Predictive Spray Charts
With defensive positioning, accuracy is critical. PitchAware’s predictive charts are proven to be significantly more accurate than the traditional ‘historical’ spray charts on the market.
Traditional spray charts show a 'historical record' of where every ball was hit. However, PitchAware's Predictive Spray Charts use machine learning and AI to run numerous simulations on past data with different charting combinations, factoring in different segments of the season, game conditions, and opponents to find the most accurate model for each individual hitter for each game.
Huge Accuracy Gains
Oregon State, who utilized PitchAware's Predictive Spray Charts for their Championship run, saw an improvement in batted ball accuracy of 86% over a traditional Spray Chart.
| Traditional Spray | PitchAware Predictive | Increase | |
|---|---|---|---|
| Oregon St | 31% | 58% | 86% |
| SEC Avg | 32% | 57% | 79% |
| Big 10 Avg | 29% | 55% | 84% |
| Big 12 Avg | 30% | 55% | 82% |
| ACC Avg | 31% | 55% | 72% |
| Pac 12 Avg | 34% | 59% | 75% |
Accuracy is determined by the percentage of batted balls that land in one of the 12 Chart zones that has a predictive score of 25% or higher.
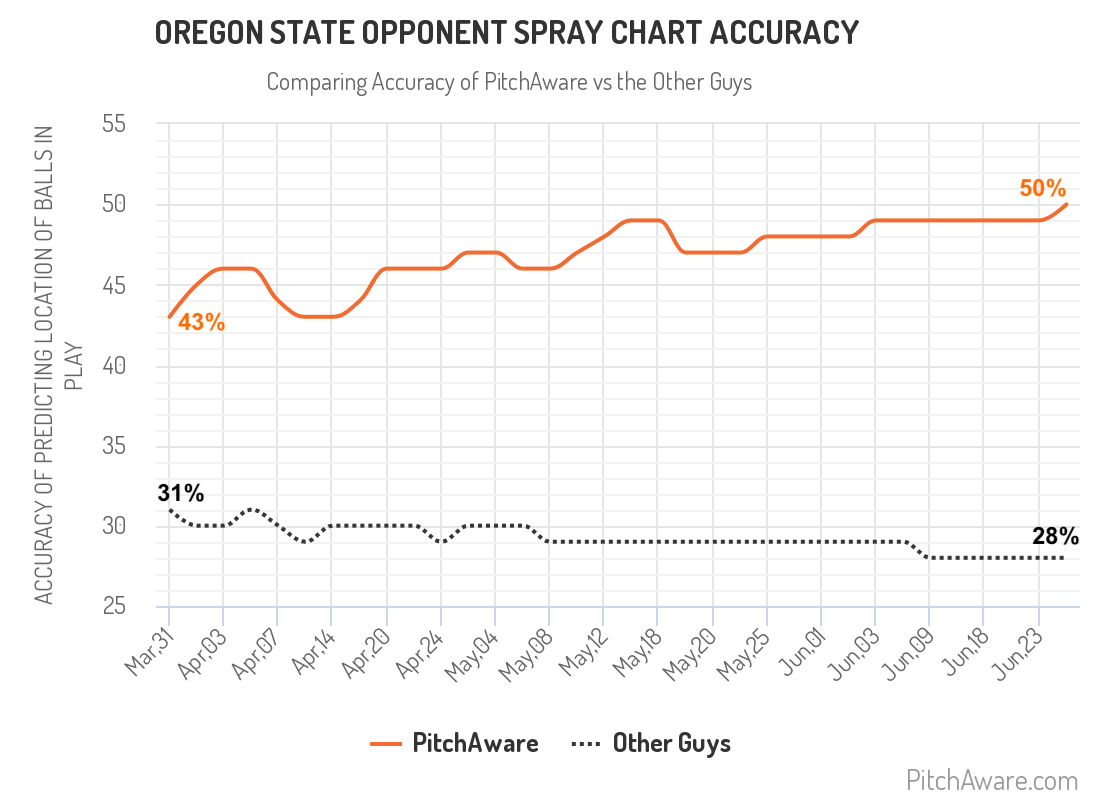
Edge To Close Season
As the season progresses our charts get more accurate, while the traditional "Historical Record" charts tend to decrease in accuracy.
If Oregon State had relied on historical spray charts they would have been 10% less accurate in postseason than at the start of conference play.
Maintain your Edge with PitchAware.
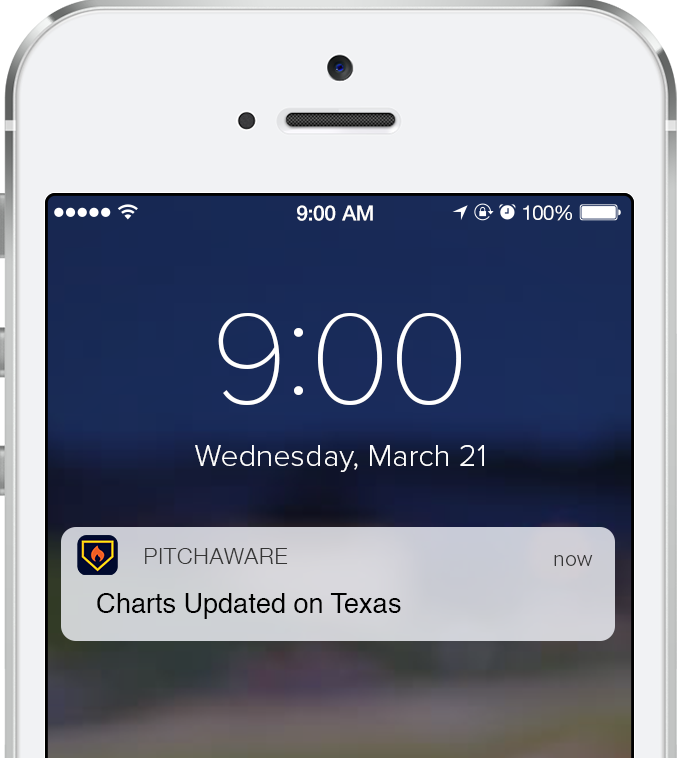
Charts Updated Next Day
Don't miss out on those valuable mid-week games with our Next Day Access.
Our software is constantly scouring the Internet looking for game stats and data. This allows us to process game data within hours of the game finishing. As soon as the data is processed your Charts are updated with Next Day Access.
Deeper Analytics
- Situational Trends and Tendencies
- Last 2 Series Analytics
- Count by Count Analytics
- Tendencies with Men on Base/RISP
- 1st AB vs 2nd AB vs 3rd AB
- First 3 Pitches vs After 3rd Pitch
- At Bats by Lineup Position
- Short Game/Base Running