Available Report Types from your AI Agent
Request a sample Report info@pitchaware.com All Reports are updated daily after new games.
Tendency/Trend
As the situations of the game change, men on base, score, count etc a pitcher and hitter’s odds of success change. How a hitter’s stats deviate from the norm illuminate keys to how their approach changes, i.e. their Tendencies. For example if the team’s batting average when behind is 15% lower than their normal average but one player is 30% lower or 30% higher this is a data point that is valuable in understanding that hitter's approach and tendencies. Or a hitter goes middle, away 70% of his/her first at bats and then as the game goes on those percentages shift heavily towards the pull side. PitchAware’s Tendency analysis compare player deviations of stat groups against the team average for hitters and conference averages for pitchers. Then the stats with the highest deviations are identified as the player’s breakout tendencies and provided in these reports.
Trend awareness is vital. We all know throughout the season each and every player will have hot and cold streaks as well as approach changes due to fatigue, injury or any number of things. PitchAware divides each and every players’ performance resume into two groups, the last 3-5 games and all the games prior. We want you to know what every hitter and pitcher is struggling or thriving on right now. Maybe a hitter's strike out and swing and miss rate is up or a pitchers swing and miss rate is up along with their ground ball percentage. To get the breakout trends we compare hundreds of thousands of data points to provide just the interesting and valuable data points in these reports.
Effectiveness Analysis
Our algorithms analyze sequences and scenarios to target in on patterns that are effecting performance, whether positively or negatively. These reports are only available to those providing us pitch by pitch level data, which allows us to identify things such as under utilized pitches, errant release point slot, not recognizing the double up breaking ball etc.
Match Up
In these reports you select the opposing team’s pitcher and our software will compare that pitcher’s tendency/trend profile with your hitters’ tendency/trend profile to identify areas where they align and diverge. For example, the pitcher might be a low launch angle, ground ball pitcher and your team is a comparatively low-rate ground ball team. How does this translate when matchups like these occur? Our data analysis will let you know and you can decide if you want to make adjustments. Maybe the pitcher struggles on the road in day games with closing at bats out when ahead and your 3,5,& 7 hitters have a higher than average ‘behind count’ batting average. They should performance well. This can be flipped as well where you pick your starter and see the matchup against the opponent’s hitters. [available by start of conference schedule 2018]
Comparisons
Peer comparisons are a great way to add relevance to stats. What is an appropriate swing rate with men in scoring position? Who has the best batting average when we are behind in late innings or OPS when go ahead runner is on base? You can compare the players on your team against each other as well as see how those metrics are trending. If you have Conference package you can also see how your team and players stack up with our Conference Comparisons.
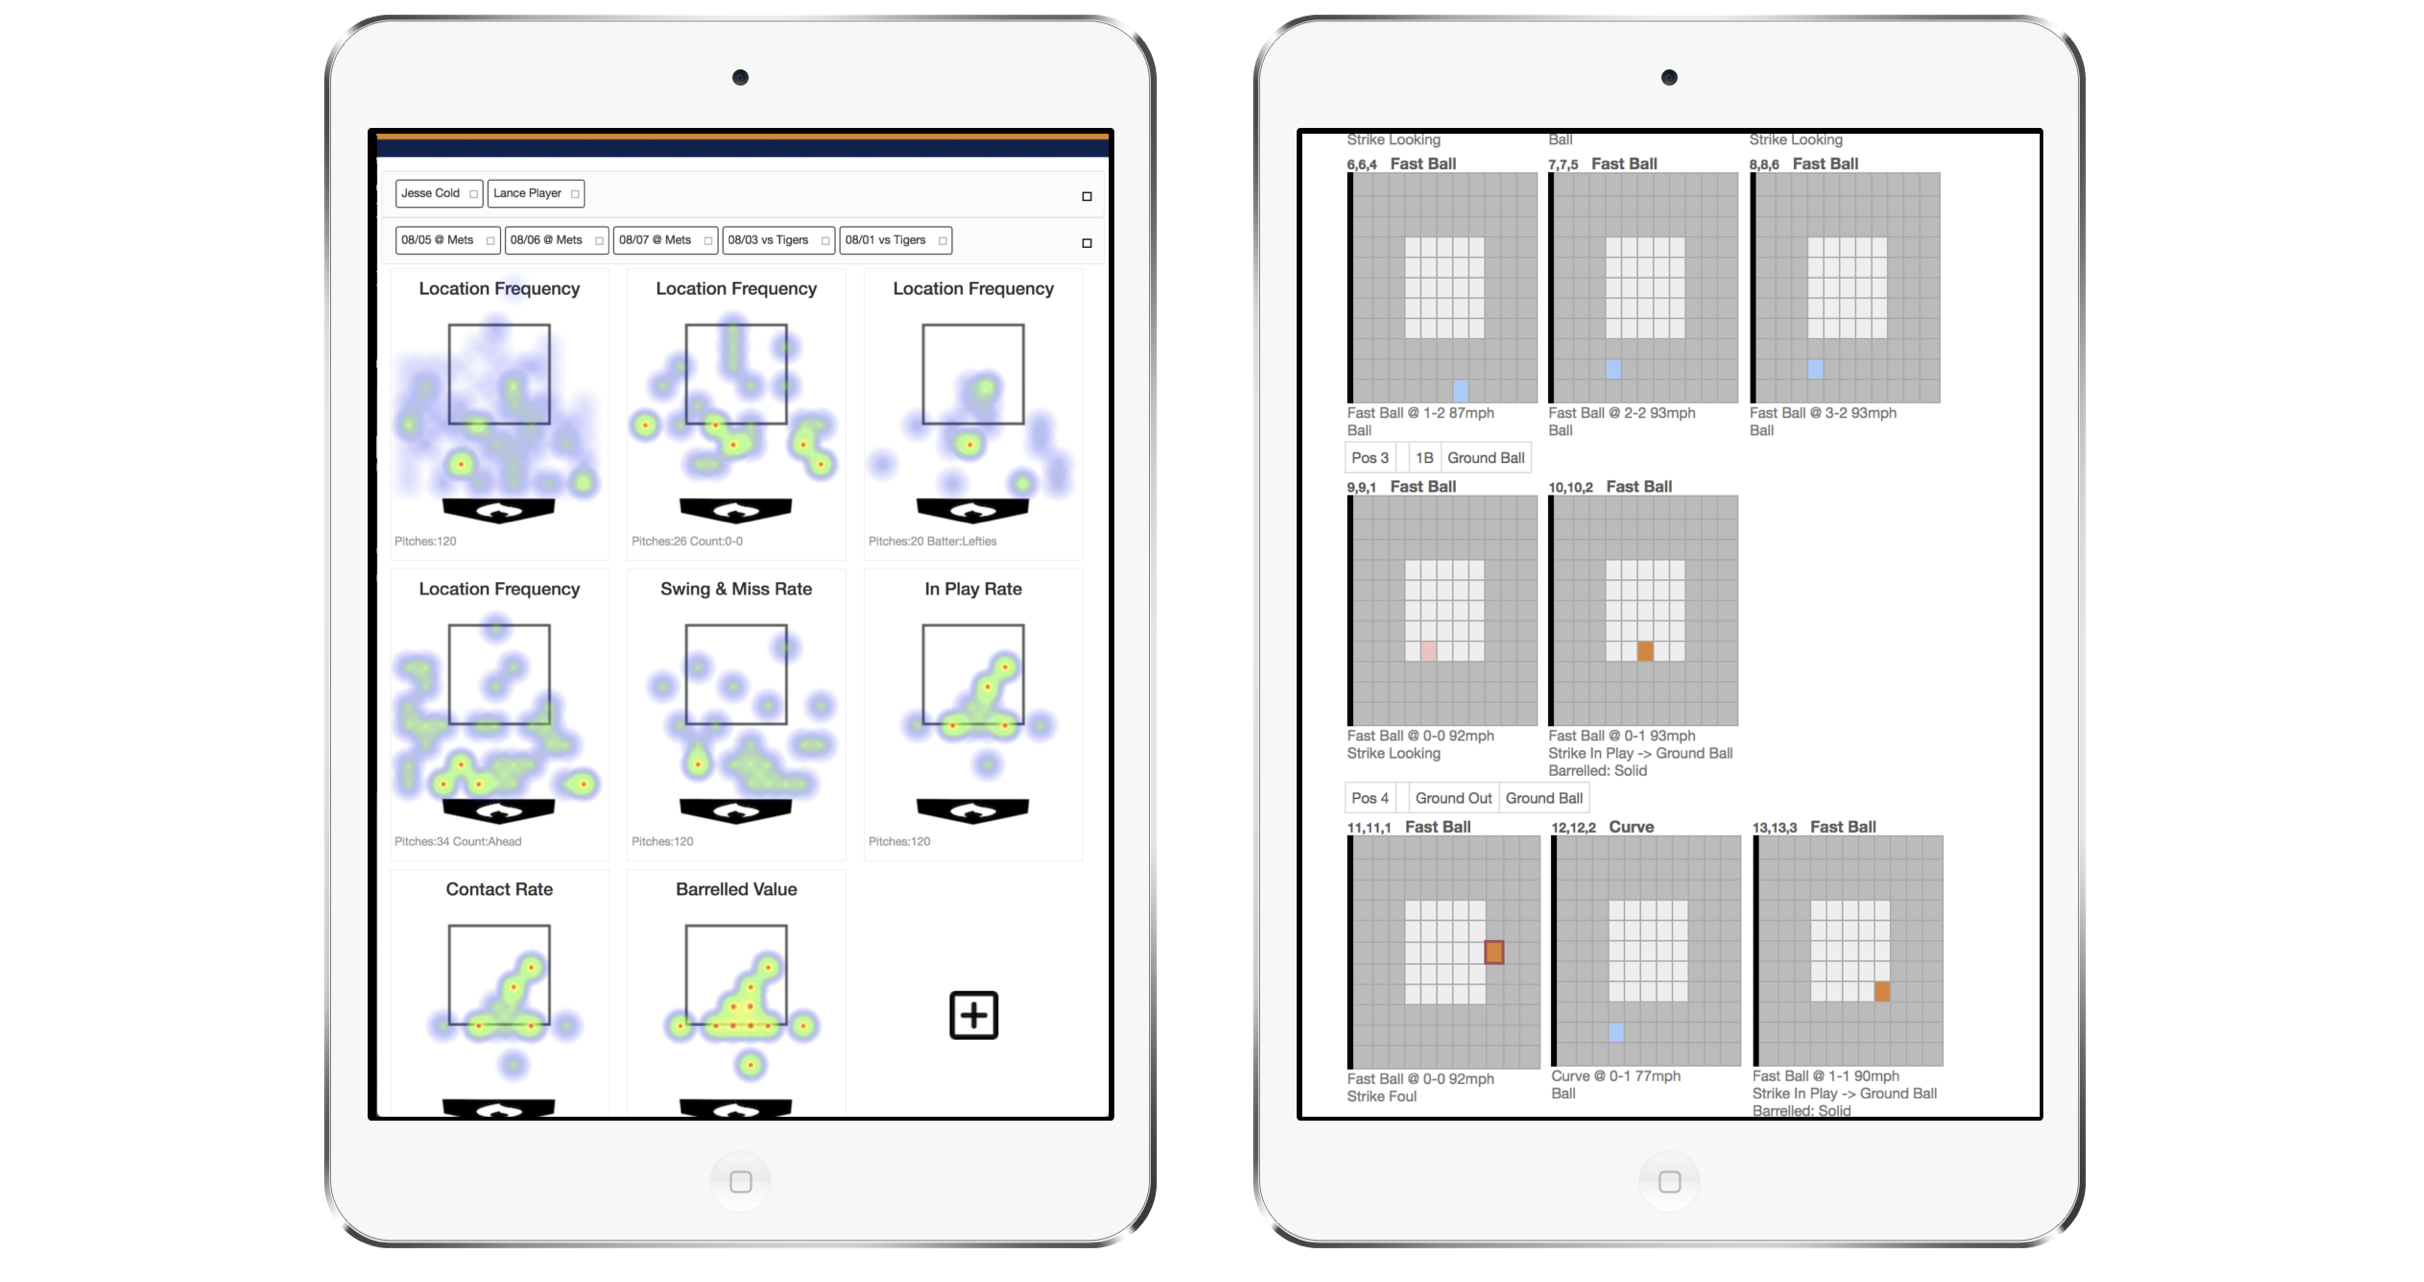
Heat Mapping & Pitch Sequencing
With Pitch by Pitch or above Data Level you will be able to look a heat maps for any count or situation and analyze not only pitch location but swings, swing and misses, level of contact, OPS, Slugging etc. All our Heat maps are stackable allowing you to dive deep.
With Pitch by Pitch or above Data Level you will be able to review pitch sequences for all at bats for both hitters and pitchers in which we have the pitch by pitch data. This is a great tool to allow players and coaches to look at the raw data with no noise, just location, sequence, situation, and result.
Below are Examples from Pitch By Pitch and Elite Data Levels
Pitcher Trend Analysis Examples
After every game get a Game/Series Report for short term analysis as well as a Season Report for longer term trends for every Pitcher. These are available in the App and can delivered as PDFs via email as well.
View example Pitcher Game/Series Report
| Pitch by Pitch | Elite |
|---|---|
| Curve is located effectively 4x more with 2 strikes than early in count. | Fastball release point off 15% from previous 2 starts, resulting in a 20% increase in balls to strikes. |
| By inning 3 the average elevation of your fastballs has risen 17% which leads to 3x more put in play. | Release point consistency is 40% worse in stretch than windup with all pitches. |
These examples are intended to show the difference in analytics detail due to the data available to PitchAware at the different plans.
Hitter Trend Analysis Examples
After every game get a Game/Series Report for short term analysis as well as a Season Report for longer term trends for every Hitter. These are available in the App and can delivered as PDFs via email as well.
View example Hitter Game/Series Report
| Pitch by Pitch | Elite |
|---|---|
| This series you are seeing more fastballs away (3.2x more and 75% of first pitches) followed by sliders down and in. | You do not drive fastballs middle away with the same authority (exit velo down 10%, average launch angle 30% off optimal) you do fastballs in. |
| Swinging and missing at 90% of off speed in the zone. | 92+mph fastballs In have your number with 78% swings and misses, however Away you barrel up more consistently. |
These examples are intended to show the difference in analytics detail due to the data available to PitchAware at the different plans.
Team Level Analysis Examples
After every game get a Game to Series Report for game to game adjustments as well as a Series to Season Report for longer term trends for the hitters and pitchers as a whole. These are available in the App and can delivered as PDFs via email as well.
| Pitch by Pitch | Elite |
|---|---|
| Series opponent swinging at 52% more breaking balls than average opponent and chasing out of the zone. | Number of pitches located Middle to Up is consistent but opponent’s launch angle is 15% more towards optimal than your average opponent. Need to pitch lower in the zone or with more breaking balls. |
| Effectively located off speed away led to a fastball In 70% of the time. | Launch angle and exit velo both down over 15% last game against the fastball. |
These examples are intended to show the difference in analytics detail due to the data available to PitchAware at the different plans.
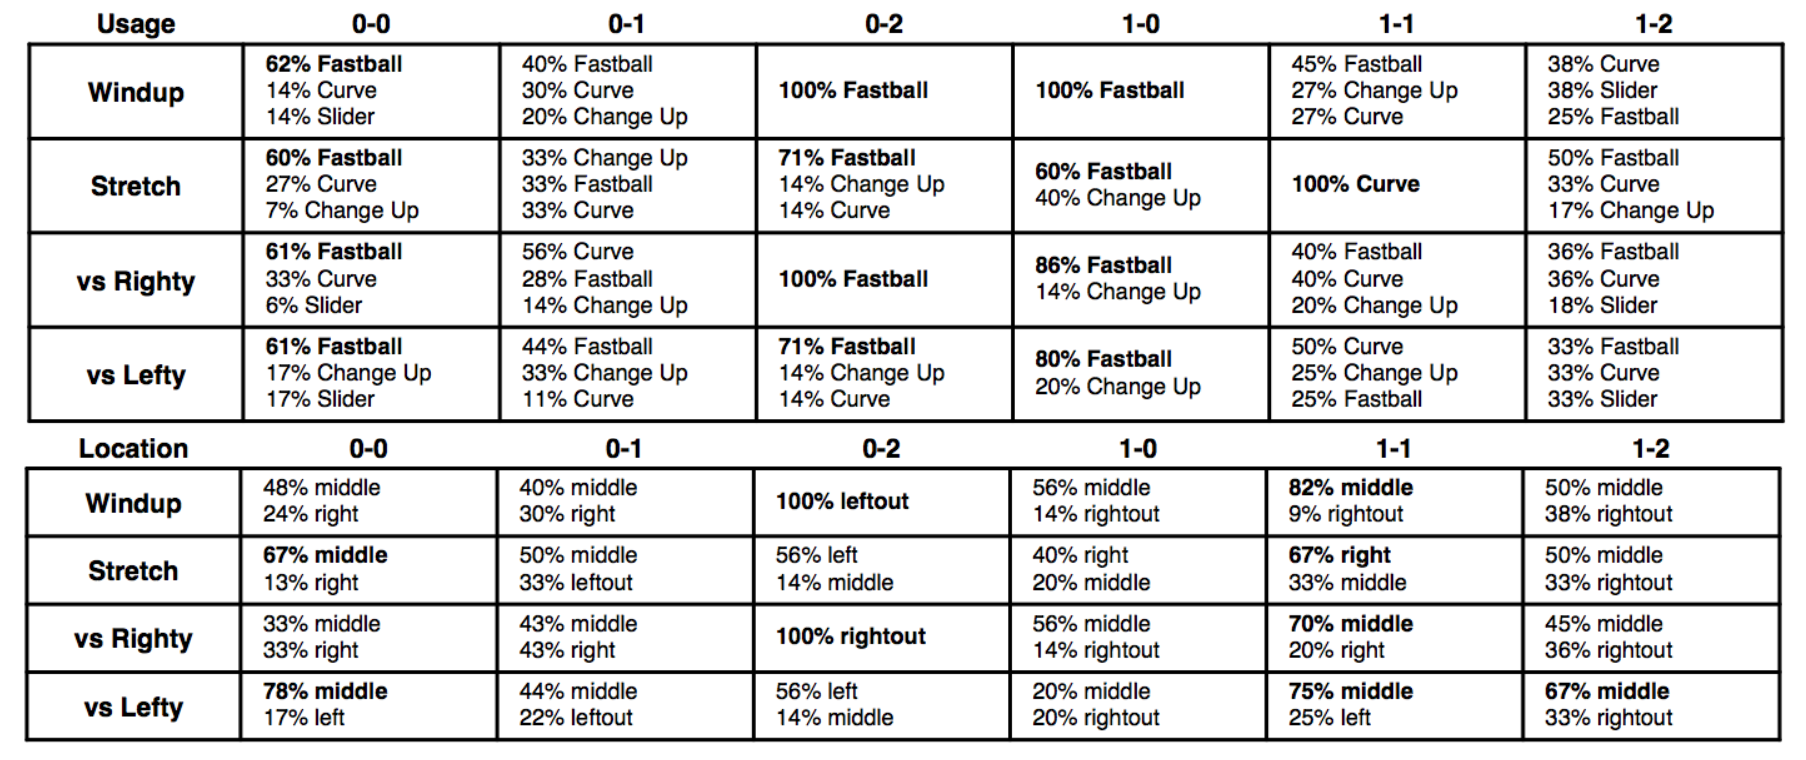
Pitch Tendencies
See Usage and Location Tendencies for your pitchers and hitters.
Have your hitters ready for that last game of the series.